Getting Started
GreenFrame lets you estimate the carbon footprint of a user scenario on a web application.
You can use GreenFrame in several ways:
- Using the GreenFrame Web UI
- In the terminal using the GreenFrame CLI
- In a Continuous Integration pipeline
This tutorial will guide you through the first method.
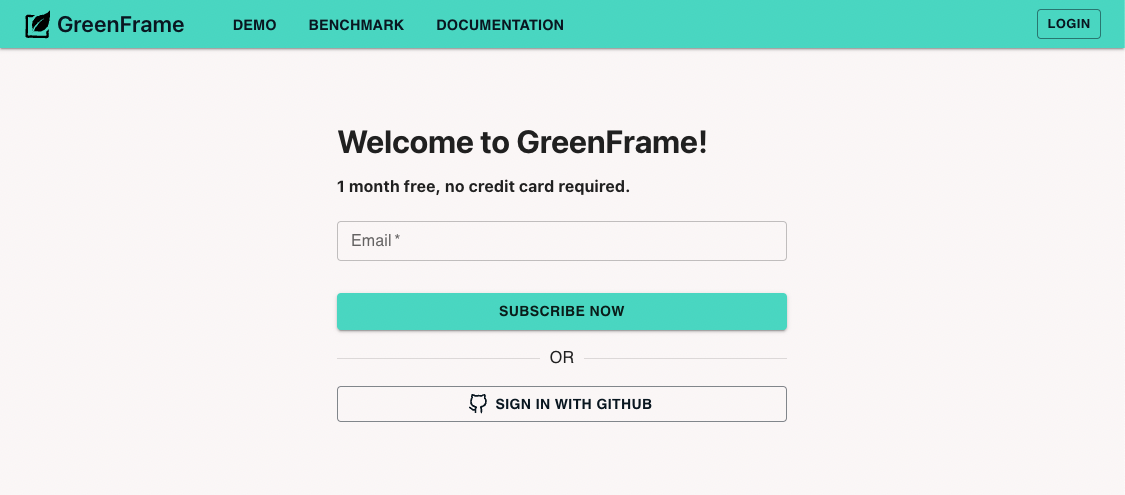
Create An Account
Go to the register page and sign up using your email or your GitHub account. Don't worry, it's free for the first month, and we won't ask you for your credit card until you decide to upgrade your account.
Once you enter your email, you will receive an activation email. Click on the link to activate your account.
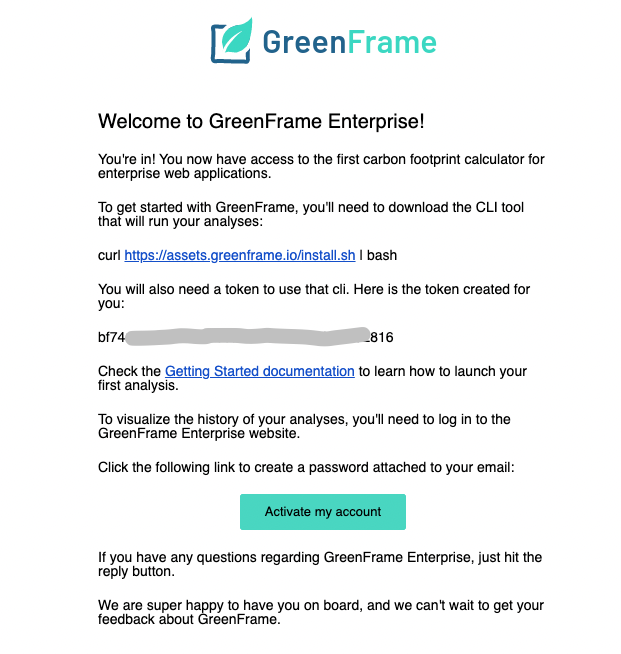
The email also contains an API token. We'll use it later in this tutorial to automate analyses in a CI pipeline.
You will have to choose a password, and you will then be redirected to the GreenFrame dashboard.
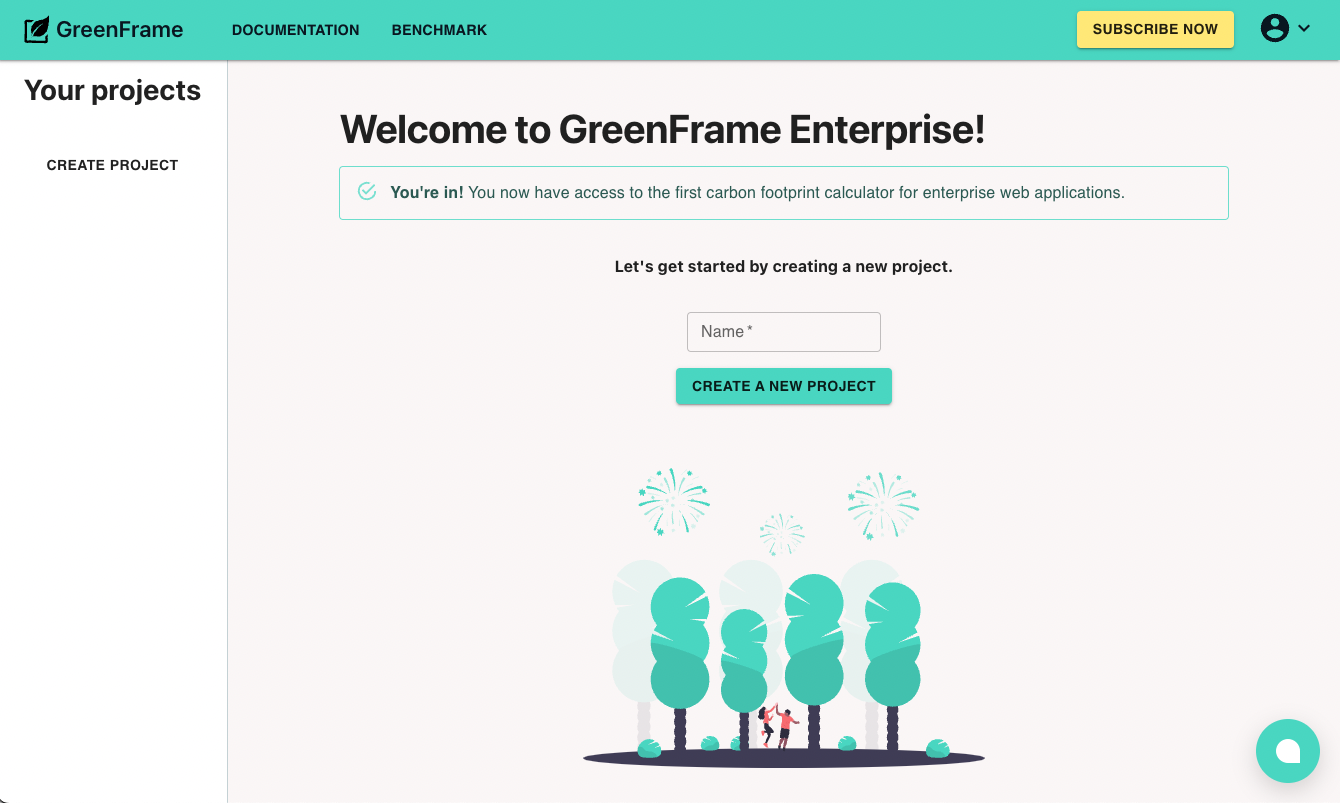
Create A Project
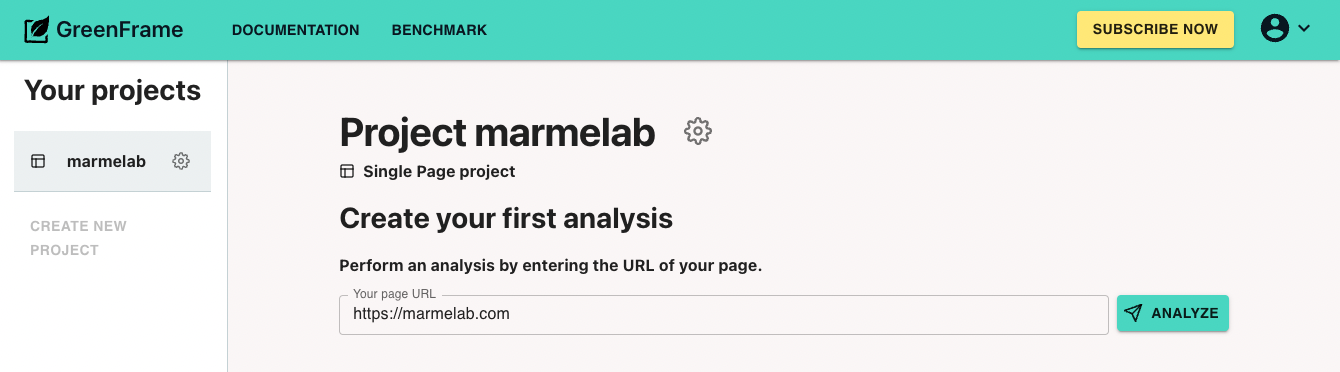
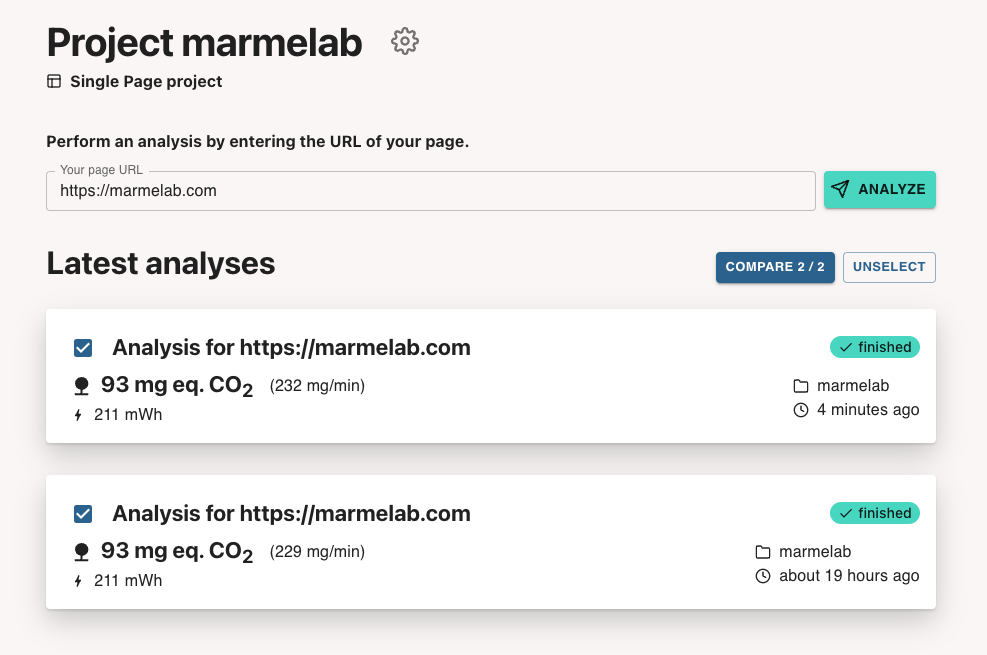
Your new GreenFrame account allows you to analyze the carbon footprint of one public website. In this tutorial, you'll analyze the Marmelab homepage (Marmelab is the editor of GreenFrame). So create a new project called "marmelab", and choose the "Single page project" type.
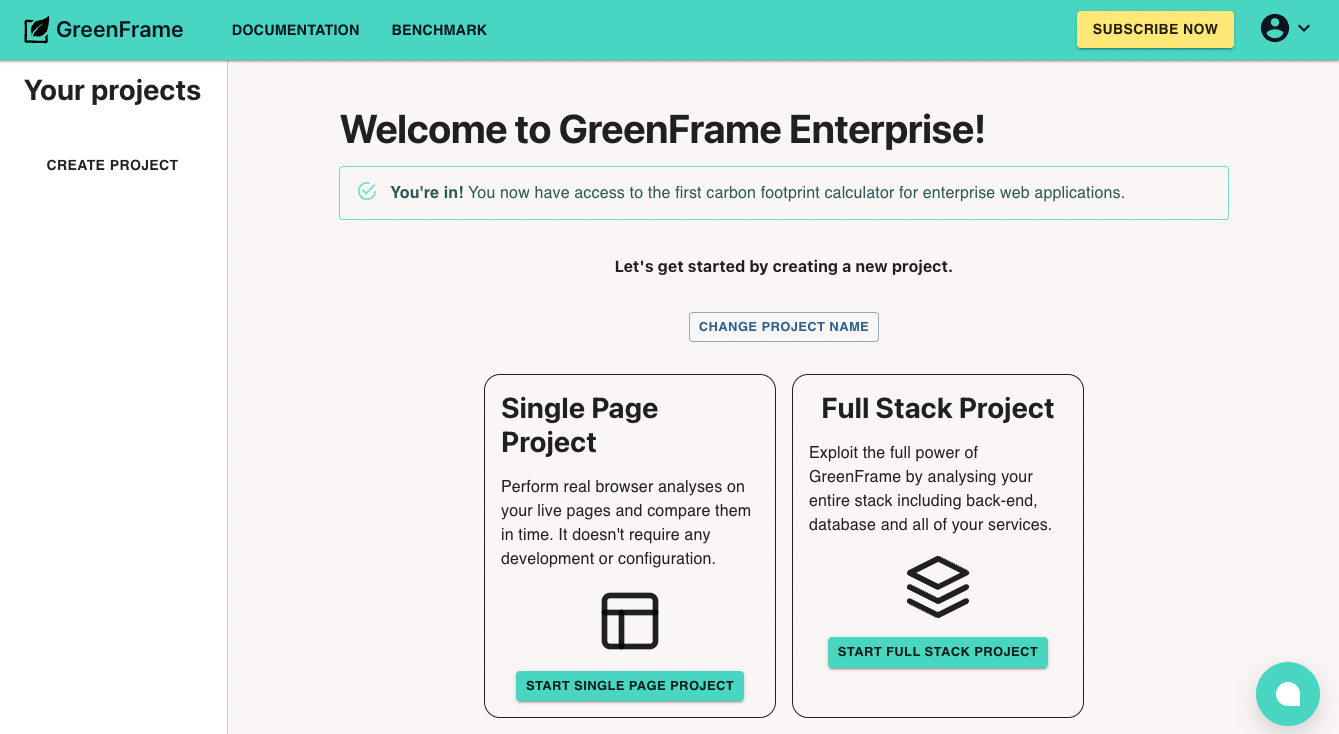
A single-page project lets you estimate the footprint of a visit to a single web page. You can also create a full-stack project, which allows you to define complex user actions and include server containers in the analysis.
On the project page, enter the URL of the page you want to analyze, and click on "Analyze".
GreenFrame will launch a browser in the cloud, and visit the URL you entered. It will record the CPU activity, the network traffic, the memory footprint, and the time taken to complete the visit. GreenFrame will run the analysis 3 times to get a more accurate value, so the analysis will appear as pending for a few minutes.
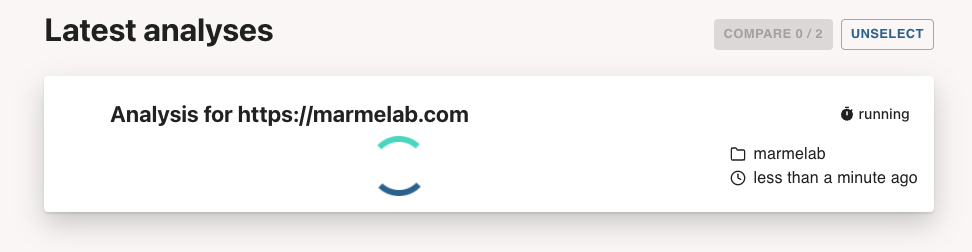
The screen will refresh automatically when the analysis is complete. When the "finished" icon appears, you can click on the analysis block to see the results.
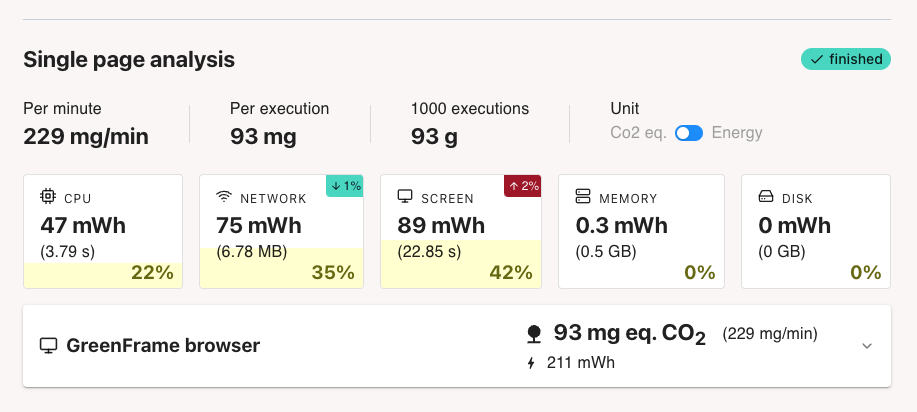
Analyze The Results
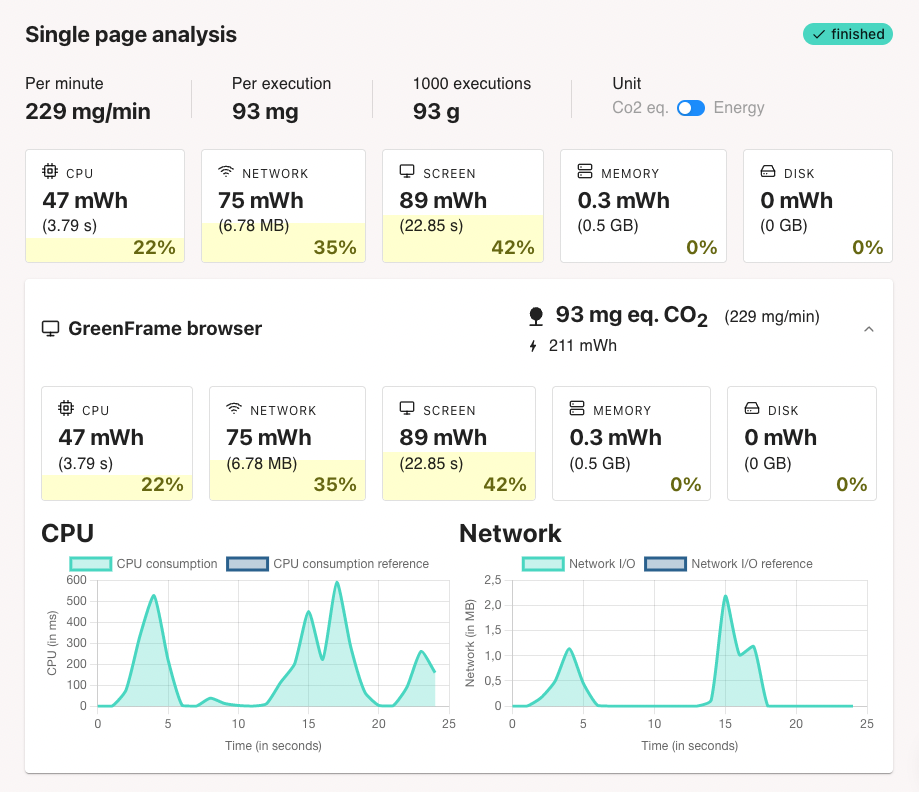
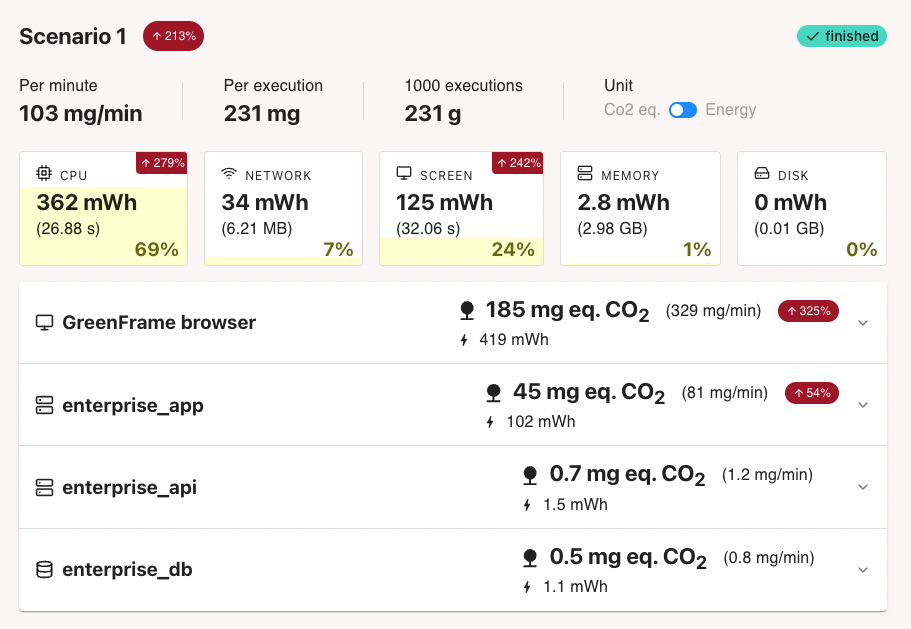
For each analysis, GreenFrame displays a summary of the carbon emissions (in g of CO2e) and the breakdown of emissions by scenario.
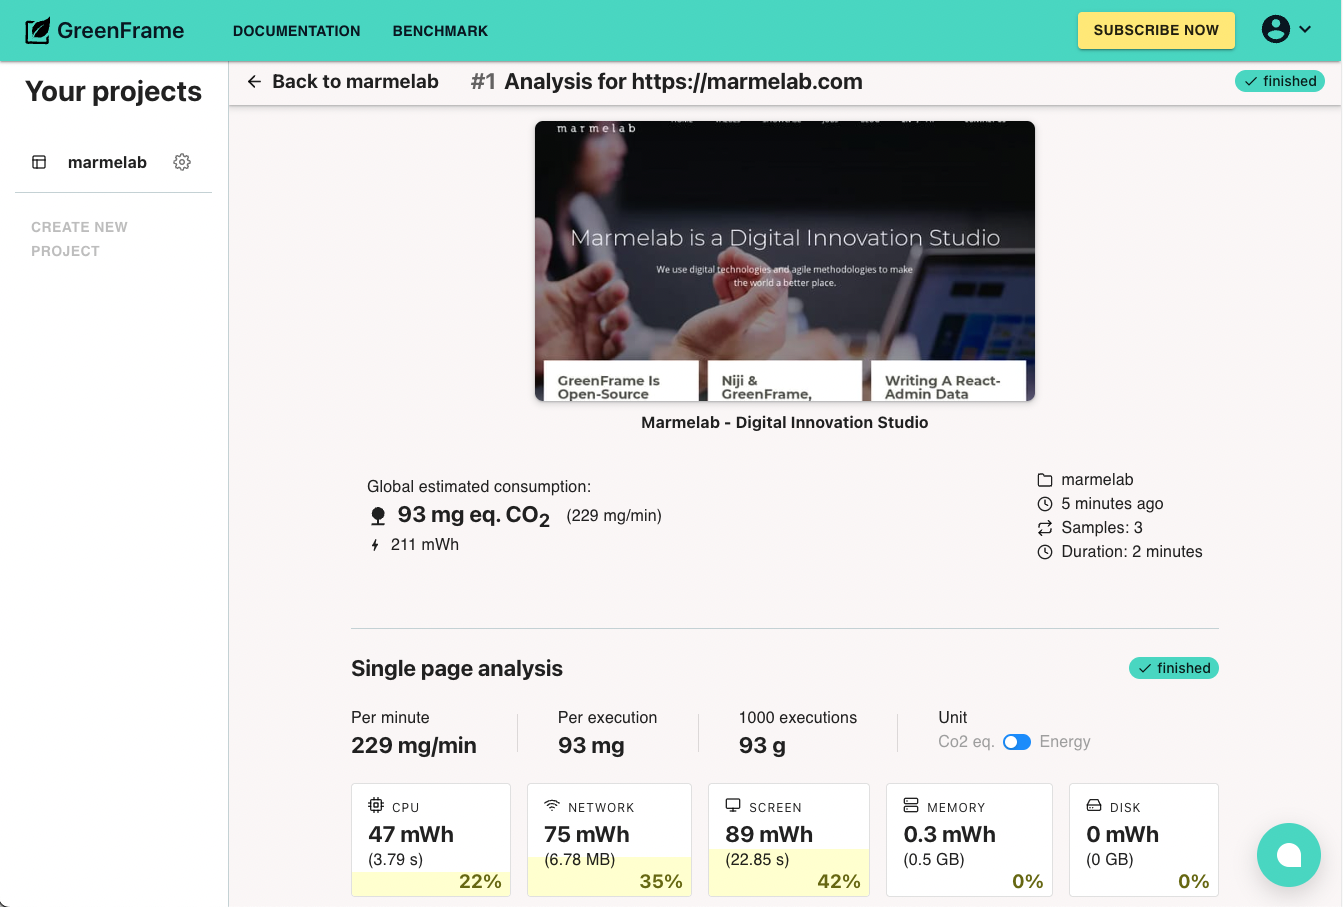
This analysis runs a single scenario called "single page analysis", and monitors the browser only. Click on the "GreenFrame browser" line to reveal the timeline of the emissions for this scenario.
You now have a reference value for the carbon footprint of that page. You can now compare this value to the carbon footprint of other web pages, or start tweaking the page to reduce its footprint.
Compare Analyses
After you make changes in the content or the code of the page, go back to the project page and run a second analysis on the same URL.
Once the analysis is complete, you can compare the two analyses by selecting the two analyses and clicking on the "Compare" button.
The comparison will show you the difference in emissions between the two analyses, and the difference in the breakdown of emissions by scenario and by component.
Small differences may not be significant. Before taking action, make sure that the difference is greater than the analysis precision.
You can compare several analyses of the same page at different points in time, or analyses of different pages.
Automate Analyses In CI
Launching analyses by hand is useful to get a first estimate of the carbon footprint of a page, but GreenFrame can do better. The recommended next step is to integrate GreenFrame in your Continuous Integration pipeline so that you can track the evolution of the carbon footprint of your web application.
To do so, create a .greenframe.yml file at the root of your repository with the GreenFrame configuration (URL analyzed, scenario file, etc.). For instance:
projectName: "marmelab"
baseURL: "http://localhost:3000"
This configuration file can set many more options. Check out the configuration reference for more details.
Next, configure your CI to run the GreenFrame CLI. For instance, on GitHub, this translates to a new workflow that grabs the code, runs the server locally, and launches the marmelab/greenframe-action action to run the analysis:
name: Greenframe Analysis
on: [push]
jobs:
  greenframeci:
    runs-on: ubuntu-latest
    name: GreenFrame
    steps:
      - name: Checkout
        uses: actions/checkout@v2
        with:
          fetch-depth: 0 # Fetch all the git history to enable git comparison
      - name: Setup node.js
        uses: actions/setup-node@v3
        with:
          node-version: 16
      - name: Start project
        run: |
          make install
          make start
      - name: GreenFrame Analysis
        uses: marmelab/greenframe-[email protected]
        env:
          GREENFRAME_SECRET_TOKEN: ${{secrets.GREENFRAME_SECRET_TOKEN}}
Next, grab your GreenFrame Token from the app.greenframe.io web UI. Click on the user menu in the top right corner, and select the "settings" menu item. In the settings page, copy the API Token and add it in GitHub as an action secret named GREENFRAME_SECRET_TOKEN.
You can find instructions for other CI providers in the CI integration guide.
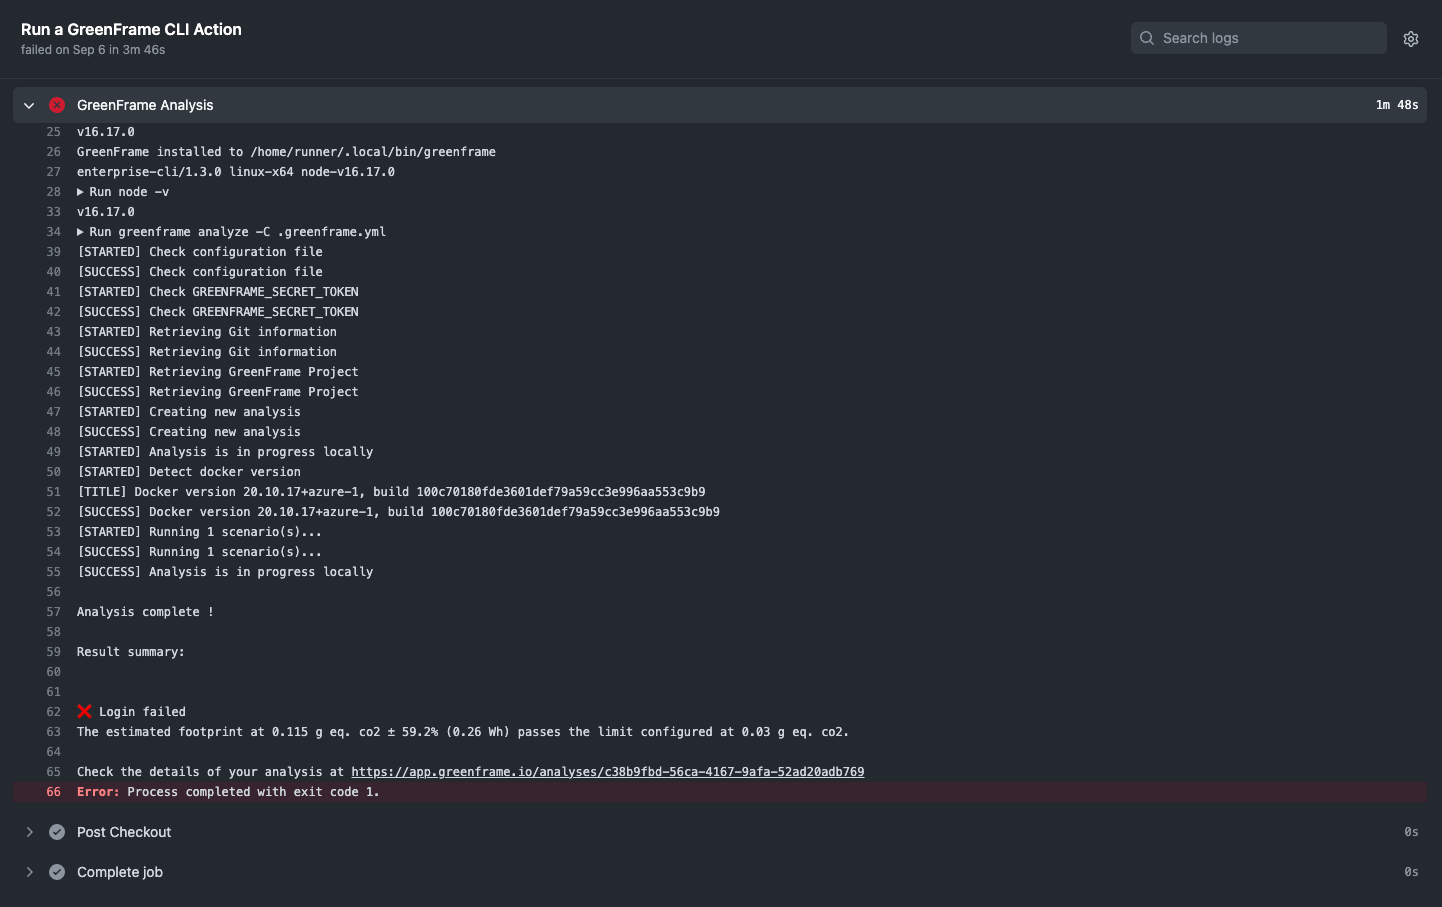
GreenFrame will now run an analysis on every push to your repository.
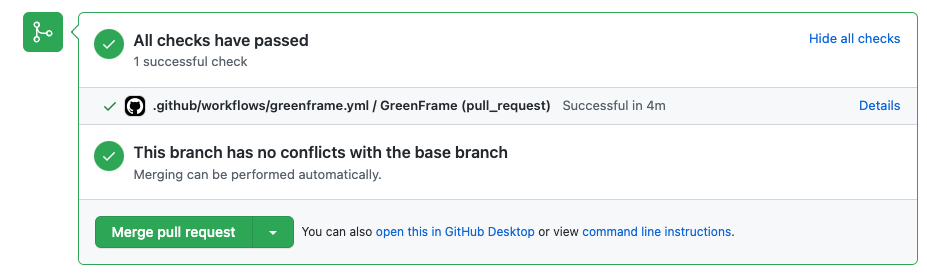
Click on the "Details" link to see the analysis results, including a link to the detailed analysis report on the GreenFrame dashboard.
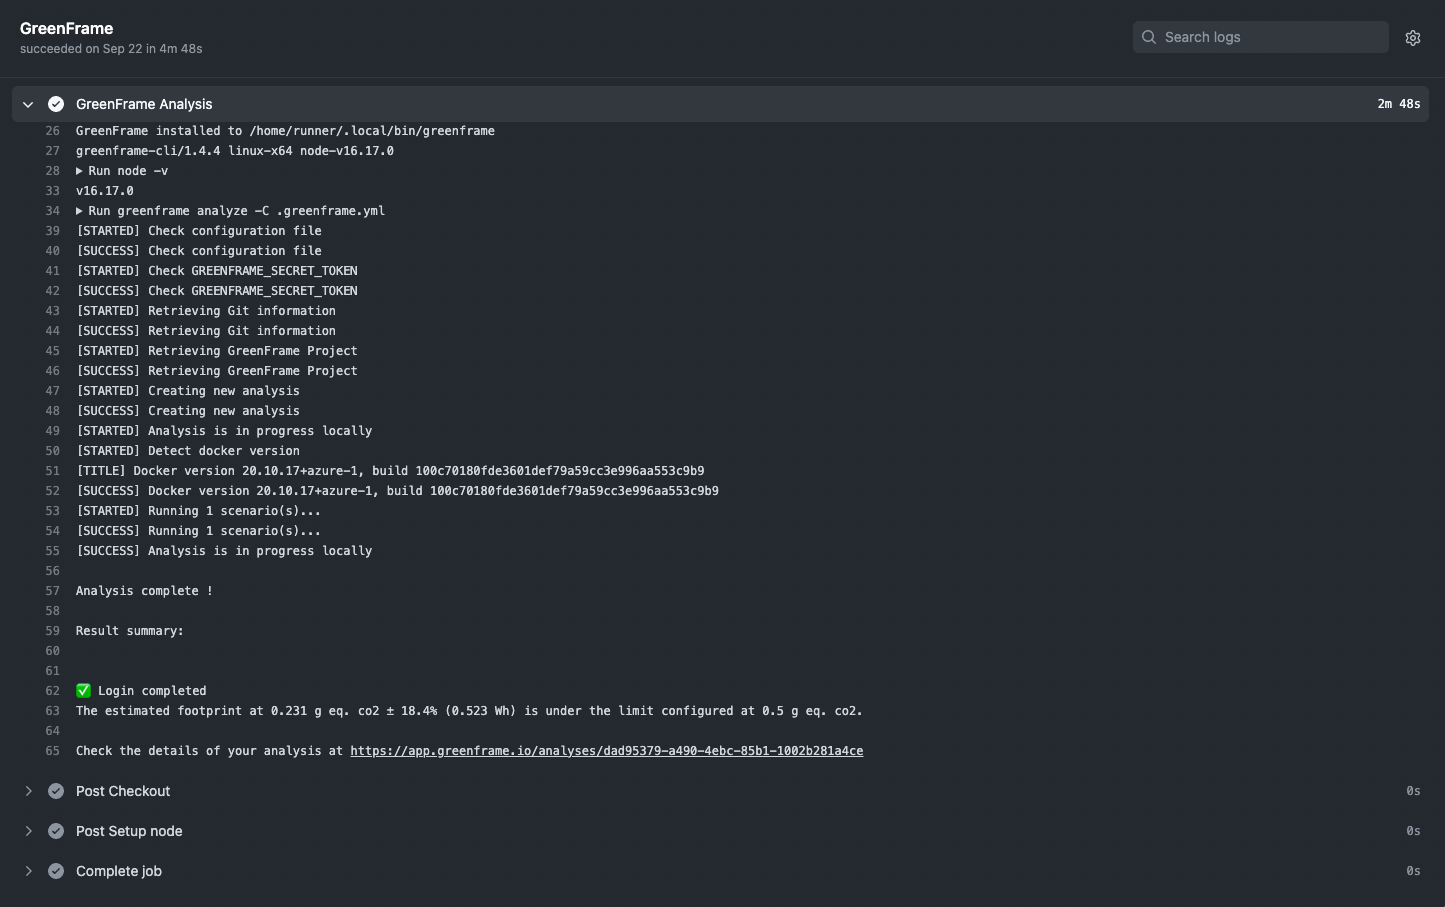
The analysis will run on your CI environment instead of in the GreenFrame cloud, so the result may be slightly different.
As it runs from a Git repository, GreenFrame gets even smarter. It finds the latest analysis on the main branch and computes the diff automatically. For pull requests, this shows the changes in carbon emissions due to the code of that pull request.
You can find an example full-stack project using GreenFrame in GitHub actions at marmelab/greenframe-demo-ra.
Prevent Carbon Leaks
Using GreenFrame in your CI pipeline is a good way to track the evolution of the carbon footprint of your application on the greenframe.io website. But the best tools are the ones you don't need to use. GreenFrame integrates with GitHub to let you monitor the evolution of the carbon footprint directly in pull requests.
Edit the GreenFrame configuration file to add an emissions threshold. For instance, if you want to fail the analysis when the carbon footprint goes over 95mg of CO2 eq, edit the .greenframe.yml file to add the threshold line:
projectName: "marmelab"
baseURL: "http://localhost:3000"
threshold: 0.095
If a push to a pull request increases the carbon footprint of the scenario beyond the threshold, the analysis will fail.
If your repository requires green builds to merge pull requests, this will prevent the merge of pull requests that increase the carbon footprint of the application - what we call a "carbon leak".
Next Steps
- You can run an analysis locally in the terminal
- You can use a custom scenario instead of the simple "visit" scenario
- You can analyze both the server and the browser footprint