Full-stack Analyses
By default, GreenFrame collects the usage metrics of a browser running the scenario. But you can also collect the metrics of the server components used to complete the scenario. This is called a full-stack analysis.
This way, you can determine where to focus your optimization efforts. You can also detect "pollution transfers", i.e. a reduction in the client that creates an increase in emissions on the server, or vice-versa. Pollution transfers don't change the overall emissions of the application, so they must be detected.
Running The Server-Side Components
For GreenFrame to collect the metrics of the server-side components, you must run them in the same environment as the browser, in docker containers. This is usually done with orchestration tools like Docker Compose or Kubernetes.
For instance, if your application runs a Node.js server and a PostgreSQL database, you probably have the following docker-compose.yml file:
version: "3"

services:
  api:
    image: node:16
    command: "yarn dev"
    ports:
      - 3006:3006
    depends_on:
      - worker
      - localstack
      - db
    volumes:
      - ./api:/app/packages/enterprise/api
    working_dir: /app/packages/enterprise/api
    container_name: enterprise_api

  app:
    image: node:16
    command: "yarn start"
    user: "${UID}:${GID}"
    ports:
      - 3000:3000
    depends_on:
      - api
    volumes:
      - ./app:/app
    working_dir: /app
    container_name: enterprise_app

  db:
    image: postgres:13
    restart: always
    volumes:
      - data:/var/lib/postgresql/data
    ports:
      - 5434:5432
    env_file:
      - ./api/.env
    container_name: enterprise_db
Before running the GreenFrame analysis, you must start your application containers. With docker-compose, that's as simple as running
docker-compose up
Including Other Containers In The Analysis
Once the server components are running, get their names with docker ps:
$ docker ps
CONTAINER ID   IMAGE        COMMAND                  CREATED         STATUS        PORTS                   NAMES
d94f1c458c19   node:16      "docker-entrypoint.s…"   7 seconds ago   Up 7 seconds  0.0.0.0:3003->3000/tcp  enterprise_app
f024c10e666b   node:16      "docker-entrypoint.s…"   7 seconds ago   Up 7 seconds  0.0.0.0:3006->3006/tcp  enterprise_api
b6b5f8eb9a6d   postgres:13  "docker-entrypoint.s…"   8 seconds ago   Up 8 seconds  0.0.0.0:5434->5432/tcp  enterprise_db
Then, add the --containers option to the greenframe analyze command:
greenframe analyze https://localhost:3000/ ./my-scenario.js --containers="enterprise_app,enterprise_api,enterprise_db"
GreenFrame will then collect the metrics of these containers while running the scenario, in addition to its own browser container.
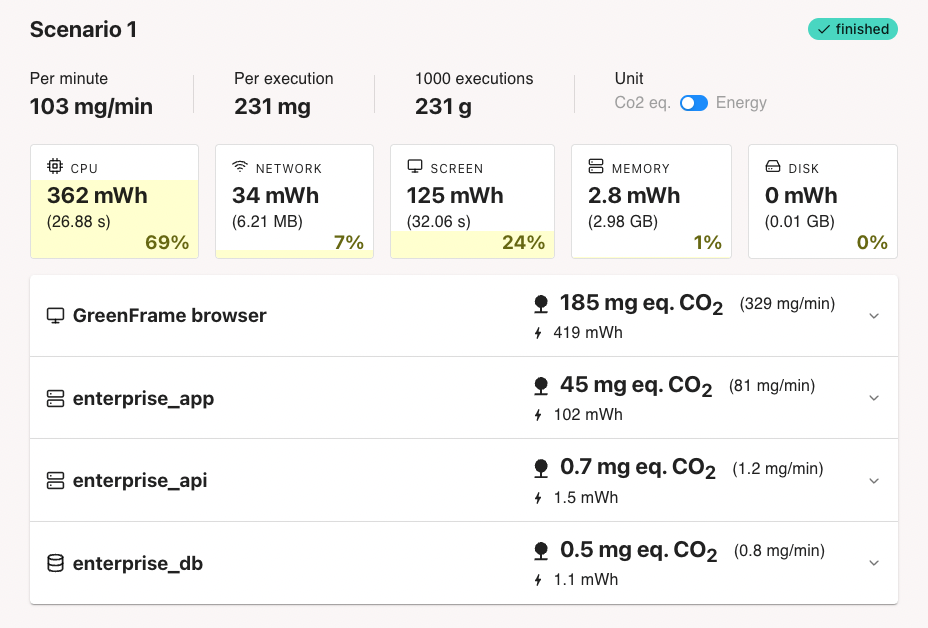
On the analysis page on greenframe.io, you will see the detail of each container.

The browser container often represents more than 80% of the total emissions. This is because GreenFrame counts the networking between the browser and the data center in the browser container.
Also, servers are optimized to process requests as fast as possible, so they are often more efficient than browsers.
Database Containers
GreenFrame computes the networking footprint differently for I/O inside and outside of the data center. To improve the accuracy of the analysis, separate the database containers by moving them to the --databaseContainers option:
greenframe analyze https://localhost:3000/ ./my-scenario.js --containers="enterprise_app,enterprise_api" --databaseContainers="enterprise_db"